Working with Landsat Data
|
1. Create a folder called Landsat. On DIA 322 computers, you might want to create this folder in your user Documents folder (e.g. C:\Users\jdoe\Documents\Landsat). On the DIA 222 computers, you might want to create this folder on the D: drive under D:\course number\user name\ (e.g. D:\ES212\jdoe\Landsat). 2. Download the data for this exercise. Step 1 of this tutorial will walk you through the extraction process. |
The data used in this exercise are from Landsat 7. The following procedures also apply to Landsat 5 and 8 (except where indicated). Note that one important difference between Landsat 5/7 and Landsat 8 is in the band configuration (see tables in Step 1).
Step 1: Extracting Imagery from a Downloaded Landsat File
Step 2: Converting Raw Data to Radiance
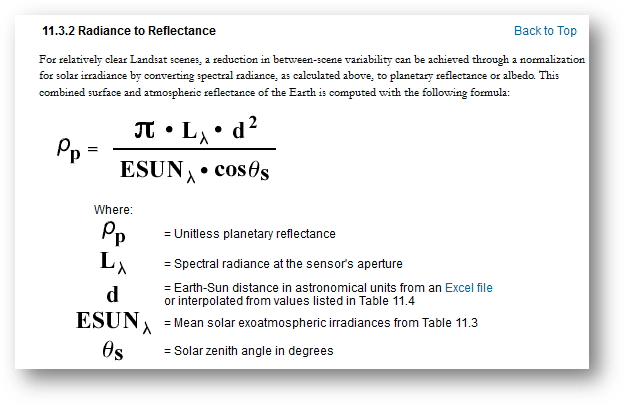
Step 3: Converting Radiance Data to Reflectance
Step 4: Creating a Landsat Composite
Landsat imagery is compressed in a tar/gz format (an archiving/compression format popular in UNIX operating system environments in the late twentieth century). A freeware tool called 7-zip will be used to extract the files.
Right-click the file and select 7-zip >> Open Archive.
In the archive window, double-click the .tar file.
This will open the contents of the .tar file (much like double-clicking a .zip file will show its contents).
Extract all files to your project folder.
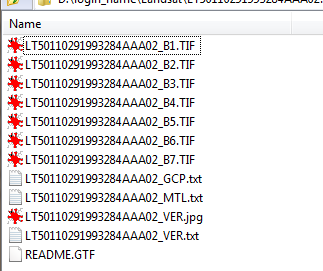
The Landsat bands are stored as separate files in a .tif file format. The number of available bands will be dependent on the Landsat source (i.e. Landsat 5, Landsat 7 or Landsat 8).
|
Landsat 4 and 5 |
Wavelength |
Resolution |
|
Band 1 - Blue |
450-520 |
30 |
|
Band 2 - Green |
520-600 |
30 |
|
Band 3 - Red |
630-690 |
30 |
|
Band 4 - Near Infrared (NIR) |
760-900 |
30 |
|
Band 5 – SWIR 1 |
1550-1750 |
30 |
|
Band 6 (Thermal) |
10400-12500 |
120* (30) |
|
Band 7 – SWIR 2 |
2080-2350 |
30 |
|
Landsat 7 |
Wavelength |
Resolution |
|
Band 1- Blue |
450-520 |
30 |
|
Band 2- Green |
520-600 |
30 |
|
Band 3 - Red |
630-690 |
30 |
|
Band 4 - Near Infrared (NIR) |
760-900 |
30 |
|
Band 5 - SWIR |
1550-1750 |
30 |
|
Band 6 (Thermal) |
10400-12500 |
60 * (30) |
|
Band 7 |
2090-2350 |
30 |
|
Band 8 |
520-900 |
15 |
|
Landsat 8 |
Wavelength |
Resolution |
|
Band 1 - Coastal aerosol |
430 – 450 |
30 |
|
Band 2 - Blue |
450 – 510 |
30 |
|
Band 3 - Green |
530 - 590 |
30 |
|
Band 4 - Red |
640 – 670 |
30 |
|
Band 5 - Near Infrared (NIR) |
850 - 880 |
30 |
|
Band 6 - SWIR 1 |
1570 – 1650 |
30 |
|
Band 7 - SWIR 2 |
2110 - 2290 |
30 |
|
Band 8 - Panchromatic |
500 – 680 |
15 |
|
Band 9 - Cirrus |
1360 - 1380 |
30 |
|
Band 10 - Thermal Infrared (TIRS) 1 |
10600 – 11190 |
100 |
|
Band 11 - Thermal Infrared (TIRS) 2 |
11500 - 12510 |
100 |
In this working example, we are working with a Landsat 5 file.
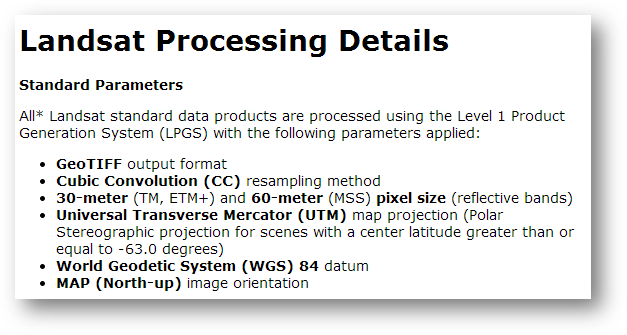
The pixel values are stored as integers and represent a minimally processed image. From Landsat’s website (March, 2014):
Computing Radiance values for each band is described in this Landsat document:
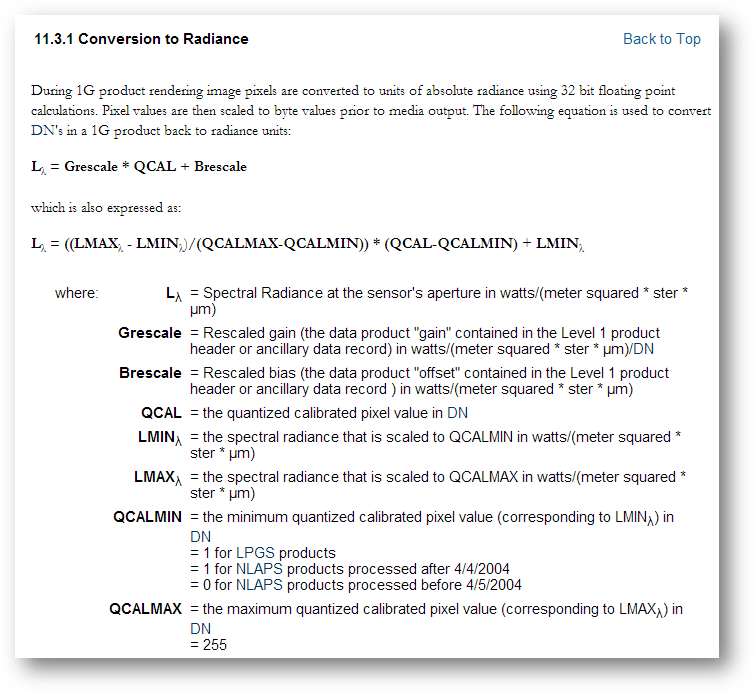
You want to use the second Ll formula listed above. The parameters LMAX, LMIN, QCALMAX and QCALMIN can be found in the *_MTL.txt file which was extracted with the other files in the .tar.gz file.
|
Equation Parameters |
MTL file parameters |
|
LMIN |
RADIANCE_MINIMUM_BAND |
|
LMAX |
RADIANCE_MAXIMUM_BAND |
|
QCALMIN |
QUANTIZE_CAL_MIN_BAND |
|
QCALMAX |
QUANTIZE_CAL_MAX_BAND |
|
QCAL |
The actual pixel value |
Note that each parameter has a unique value for each band.
Find the values for each parameter and each band in the *_MTL.txt file and populate the following table (which you will reproduce in a spreadsheet). An example is presented for the first band.
|
Band number |
LMIN |
LMAX |
QCALMIN |
QCALMAX |
|
1 |
-1.520 |
193.000 |
1 |
255 |
|
2 |
|
|
|
|
|
3 |
|
|
|
|
|
4 |
|
|
|
|
|
5 |
|
|
|
|
|
6 |
|
|
|
|
|
7 |
|
|
|
|
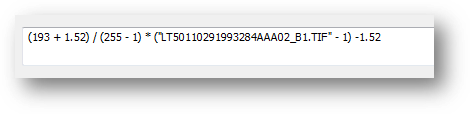
Next, using the Raster Calculator, you will create a Radiance raster for each band using the values tabulated above and name them Radiance1.img, Radiance2.img, …, Radiance7.img.
The following example is for band 1.
Next, we will want to normalize the upwelling radiance to the downwelling sunlight impinging on the earth’s surface. This will eliminate the influence of the sun’s spectral shape from that of the ground features being investigated.
The same Landsat document used in the last step provides instructions on converting radiance data to reflectance data. Note that band 6 is a thermal infrared band and is therefore computed differently.
Landsat 5 and 7:
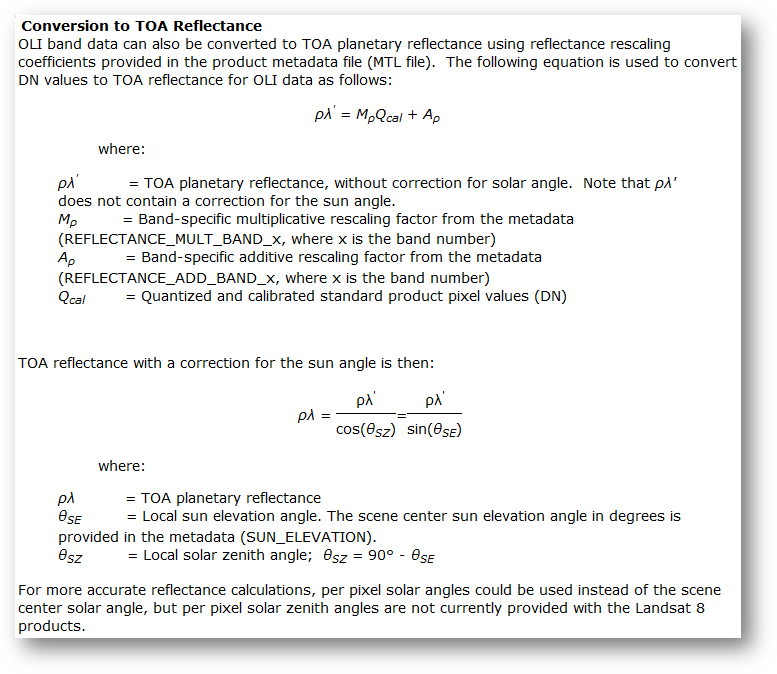
Note, when working with Landsat 8 data, use the following formula:
The solar irradiance values for each band, ESUNl, at the top of the earth’s atmosphere (exoatmospheric irradiance) are listed below. Note that the tabulated values are optimized for Landsat 7 data (hence the addition of band 8 not present in Landsat 5) but can be used with Landsat 5 data.
NOTE: If working with Landsat 8 data, you do not need to optimize for exoatmospheric spectral irradiances.
|
Band |
watts/(meter squared * μm) |
|
1 |
1970 |
|
2 |
1842 |
|
3 |
1547 |
|
4 |
1044 |
|
5 |
225.7 |
|
7 |
82.06 |
|
8 |
1369 |
The earth-sun distance, d, varies throughout the year. A range of values is shown below. Note that Landsat offers an Excel spreadsheet with additional distance values.
|
Earth-Sun Distance in Astronomical Units |
|||||||||
|
Day of Year |
Distance |
Day of Year |
Distance |
Day of Year |
Distance |
Day of Year |
Distance |
Day of Year |
Distance |
|
1 |
.98331 |
74 |
.99446 |
152 |
1.01403 |
227 |
1.01281 |
305 |
.99253 |
|
15 |
.98365 |
91 |
.99926 |
166 |
1.01577 |
242 |
1.00969 |
319 |
.98916 |
|
32 |
.98536 |
106 |
1.00353 |
182 |
1.01667 |
258 |
1.00566 |
335 |
.98608 |
|
46 |
.98774 |
121 |
1.00756 |
196 |
1.01646 |
274 |
1.00119 |
349 |
.98426 |
|
60 |
.99084 |
135 |
1.01087 |
213 |
1.01497 |
288 |
.99718 |
365 |
.98333 |
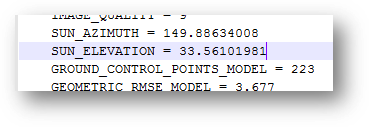
The sun solar zenith angle, qs, is found in the *_MTL.txt file and is listed as the parameter SUN_ELEVATION.
Caution:
The formula calls for a trigonometric function, cos(). Some applications require that the angle be defined in units of radians while others require that the angle be defined in units of degrees. According to ArcGIS documentation, the angle value must be in radians when using Raster Calculator.
The formula explicitly asks for a zenith angle which is measured from nadir (solar noon) to the sun location whereas solar elevation (as presented in the MTL file) is measured from the horizon up.
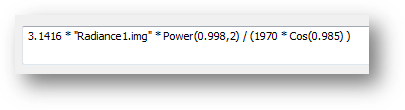
Next, using Raster Calculator, compute the reflectance rasters for bands 1, 2, 3, 4, 5, and 7 (band 6 will be treated differently in a later step). Name the outputs Reflectance1, Reflectance2, …, Reflectance7. This scene was acquired on October 11, 1993 (day 284 of the year 1993). Use an earth-sun distance of 0.998. Also, you will need to adjust the solar angle (see cautionary note above) as follows: angle = p/180 * (90 - 33.56) = 0.985.
The following example is for band 1. Note the use of the Power() function to raise the distance to the power of 2 and note the upper case C in the Cos() function
3.1416 * "Radiance1.img" * Power(0.998,2) / (1970 * Cos(0.985) )
Band 6 is a thermal infrared band and is computed differently as outlined in the Landsat document:
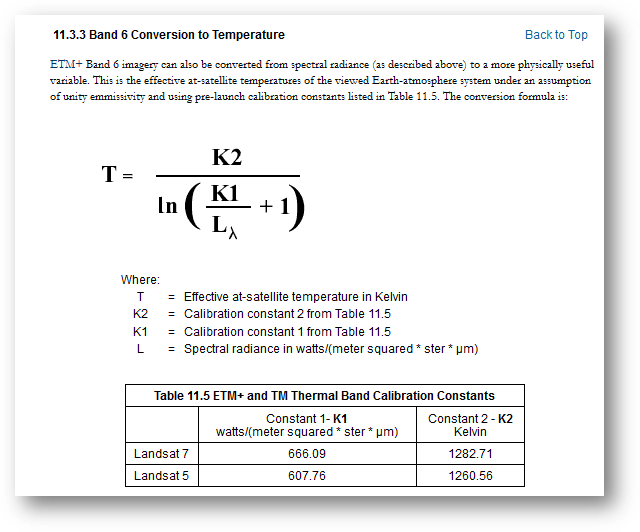
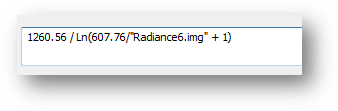
For band 6, compute the thermal infrared temperature values as follows:
1260.56 / Ln(607.76/"Radiance6.img" + 1)
Name the output file Thermal6.img.
Next. we’ll combine these bands to generate a composite Landsat raster file.
In a new ArcMap session, open Data Management Tools >> Raster >> Raster Processing >> Composite Bands and fill out the parameters as shown below.
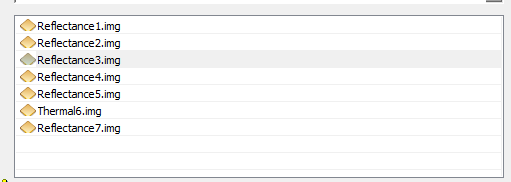
Name the output Landsat.img.
You now have a complete, post-processed, Landsat scene. Note, however, that the file is stored as a float which can take up a lot of disk space.
![]() Manuel Gimond, last modified on, 4/6/2017
Manuel Gimond, last modified on, 4/6/2017